MagickVoice Help Center — Campaigns
Campaign analytics
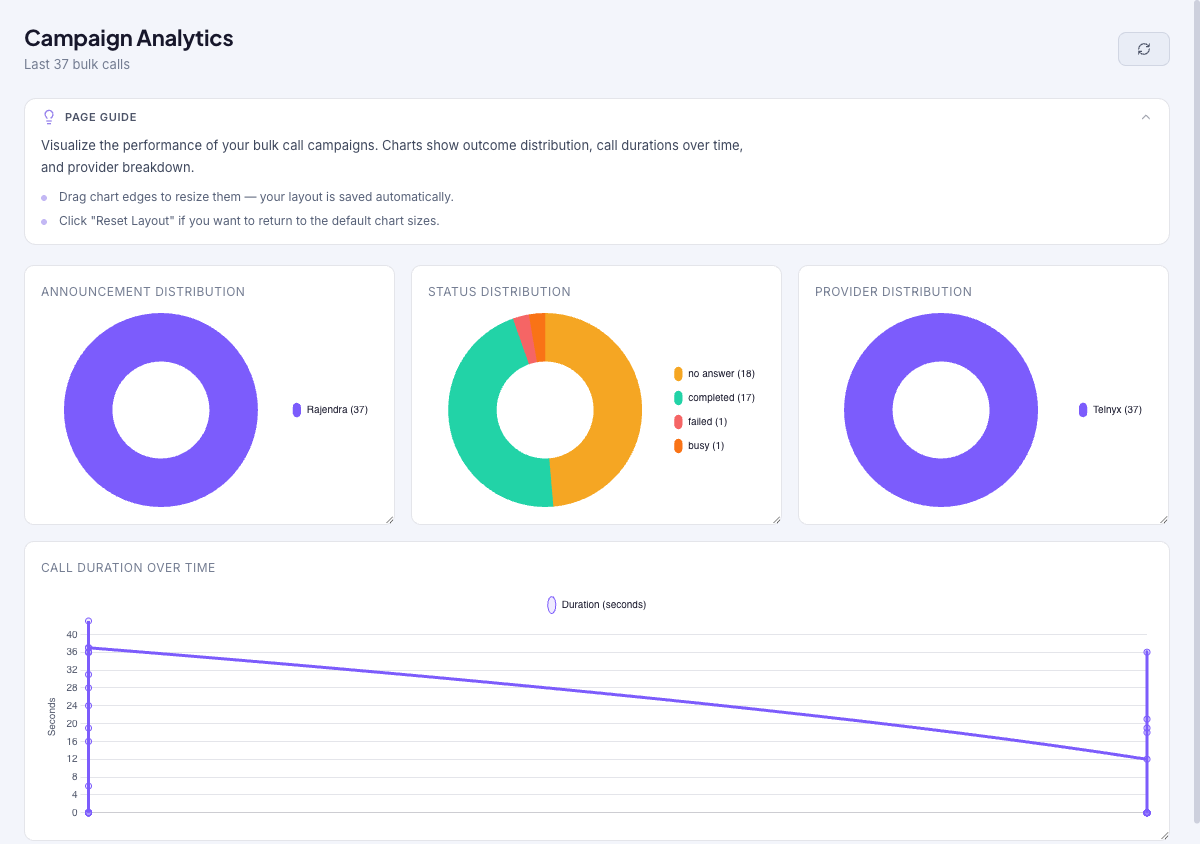
Visualize the performance of your bulk call campaigns across your recent calls. Charts show the distribution of announcements used, call statuses, providers, and call duration over time, so you can spot what is working and improve the next send. Chart sizes are resizable and your layout is saved automatically.
Audience: Campaign managers · Page address: /app/campaign-analytics · Your admin may need to enable this feature
Common tasks
- Review outcome and status distribution
- Compare providers and announcements
- Read call duration over time
- Apply findings to the next campaign
How to use this page
1. Understand what analytics shows
Know the scope of this page so you read the charts correctly.
- The page visualizes the performance of your bulk call campaigns across your most recent calls (the header notes the sample, for example Last 37 bulk calls).
- Four charts summarize the data: Announcement Distribution (which voice messages were used), Status Distribution (how the calls ended), Provider Distribution (which carriers carried the calls), and Call Duration Over Time.
- This is the cross-campaign trend view; for one campaign's outcomes, use its campaign detail page instead.
- Confirm the tenant in the top bar — analytics cover the tenant you are in.
2. Read the charts
Turn the charts into decisions about your calling.
- Use Status Distribution to see how calls ended overall — a large share of no-answers or failures signals a timing or delivery problem worth fixing.
- Use Provider Distribution to compare carriers, and Announcement Distribution to see which messages you have been sending most.
- Use Call Duration Over Time to spot whether calls are getting longer or shorter across recent sends.
- Select Refresh campaign analytics to pull the latest data.
3. Adjust the layout
Arrange the charts to suit how you review them.
- Drag a chart's edge to resize it. Your layout is saved automatically.
- Select Reset Layout to return to the default chart sizes.
4. Apply the findings
Close the loop by feeding what you learn back into your next send.
- If status distribution shows many no-answers, adjust timing on your next campaign or use Schedule for Later to call at a better hour.
- If one provider underperforms, choose a different Number people will see in the Composer, since that sets which provider carries the calls.
- Compare against a single campaign's outcome breakdown to confirm whether a trend is one bad campaign or a broader pattern.
Tips and troubleshooting
- Review campaign settings before dispatch because recipient mistakes can be expensive to unwind.
- Use analytics after delivery to compare completion, failures, and response trends before sending the next batch.
- Charts cover your most recent bulk calls, so they reflect recent activity rather than an arbitrary date range.
- Drag a chart's edge to resize it — your layout is saved automatically, and Reset Layout restores the defaults.